Mapping Products and Services
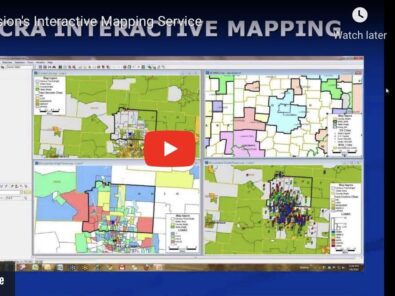
Mapping technology offers you the potential to visualize your market like never before. Mapping creates geographic pictures of your loans and deposits as well as competitor loans and deposits and branch locations. These "data pictures' allow you to see and understand your markets like never before. Even more exciting, by combining mapping with GoTo Meetings any bank today, big or small, can enjoy the advantages of mapping their markets. Learn more about GeoDataVision Live Mapping Services.
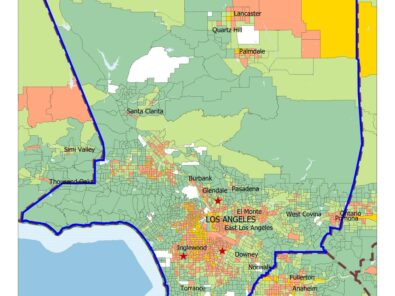
Assessment Area (AA) maps include the delineation of your Assessment Area boundaries, key towns and cities, major roads, census tract income classifications (color-coded) and branches. The map meets all regulatory standards for your CRA Public File.
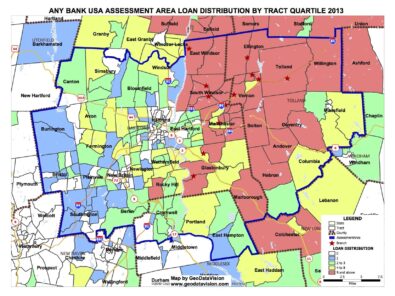
Depict your bank’s lending in and around your Assessment Area. "Single theme" and "double theme" maps display your lending activity (dollars and units) to reveal the geographic dispersion of your small business and mortgage lending.
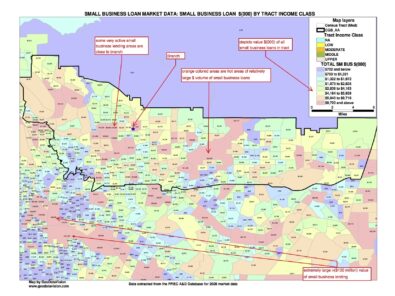
GeoDataVision creates maps of geographic areas (bank AA, county, etc.) and displays the market data (Small Business or HMDA) in units and dollars. The maps provide a geographic image of local mortgage and small business loan markets.
Mapping technology offers you the potential to visualize your market like never before. Mapping creates geographic pictures of your loans and deposits as well as competitor loans and deposits and branch locations. These "data pictures' allow you to see and understand your markets like never before. Even more exciting, by combining mapping with GoTo Meetings any bank today, big or small, can enjoy the advantages of mapping their markets. Learn more about GeoDataVision Live Mapping Services.
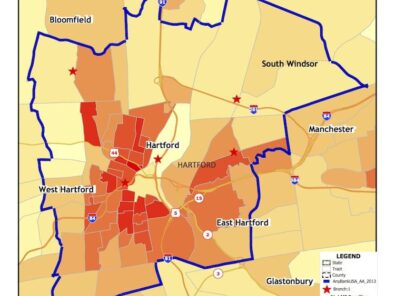
We can capture demographics, such as Minority Populations, and display them in layered screen colors for visual analysis of their location and size.
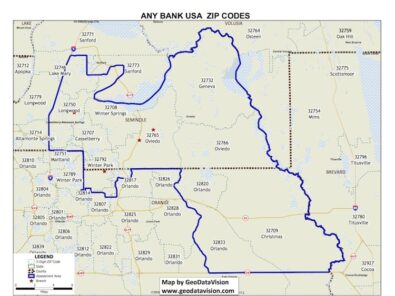
Another use of AA Maps is to overlay zip code boundaries on them along with zip code numbers, for identifying their location in proximity to tracts, towns, counties, etc.
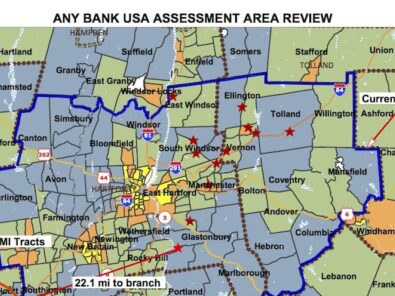
This is a unique GeoDataVision service that allows banks to use sophisticated mapping technology to analyze their markets. No mapping skills are required for you to take advantage of this service. GeoDataVision employs GoTo Meeting's ™ service to create live interactive meetings during which a GeoDataVision professional manipulates live maps containing important market data that allow you to see your markets like never before. Having “active” maps offers exciting analytical options. Factors such as income demographics, minority population, mortgage market and small business loan market activity, "drive-time" analysis, and much more, can be viewed, manipulated, and captured in file maps for use by the bank in hard copy printouts.
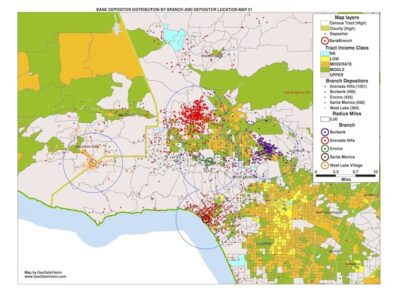
Maps of deposits and depository branches included in the annual Summary of Deposits (SOD) data released by the FDIC.

Maps for analyzing variables in determining the effects
© copyright 2022. All RIghts Reserved
© copyright 2024. All Rights Reserved

