Loan Distribution Maps
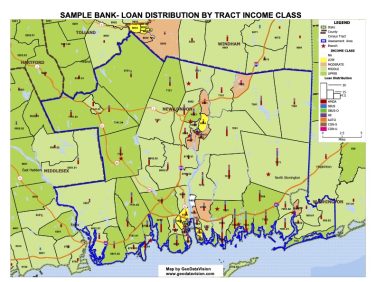
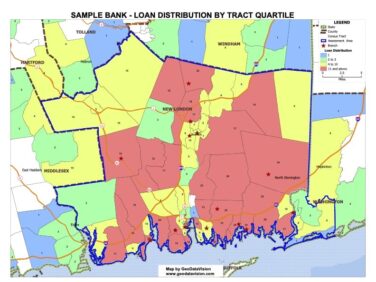
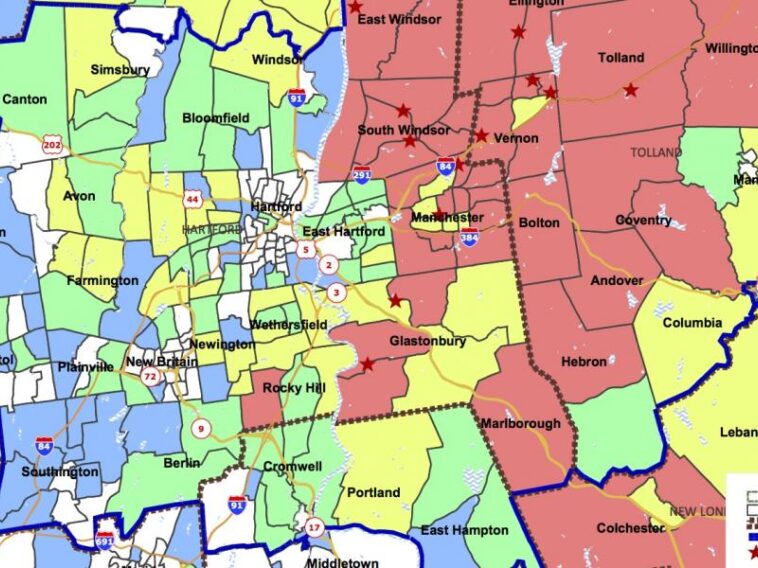
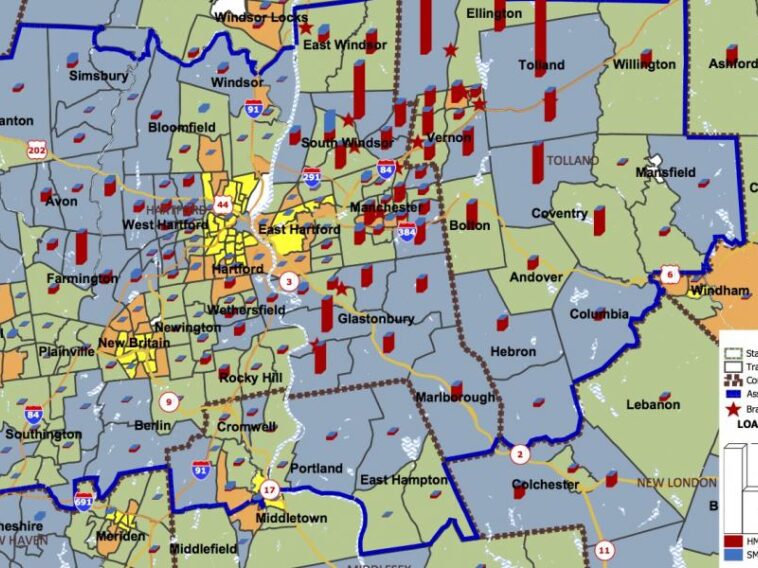
CRA performance analysis requires you to recognize lending gaps in your Assessment Area. These gaps are almost unrecognizable using traditional loan distribution tables. Computerized mapping technology can create a picture of your loan distribution and help your see the geographic aspect of your lending. There is no better tool than loan distribution maps for this important task.
GeoDataVision has an expertise in the creation of loan distribution maps for CRA analysis. We use color themes to paint a picture of the geographic pattern of your loan distribution. Our single- and double-color theme maps make it easy to quickly discern potential loan distribution problems.
Pricing is per Assessment Area for a standard set of 4 color theme maps that depict your loan units and loan dollars using single and double theme maps that expose lending gaps and reveal relative loan volume in low- and moderate-income neighborhoods. For multiple Assessment Areas please inquire about discounted pricing.
GeoDataVision also can create a set of loan distribution tables that match the CRA Lending Tests to complement your maps.
Need help?
Prefer speaking with a human to filling out a form? Call our corporate office and we will connect you with a team member who can help.
(203) 907-7497
© copyright 2024. All Rights Reserved


