GeoDataVision — CRA, HMDA & Fair Lending Compliance Data, Reports & Maps for Financial Institutions

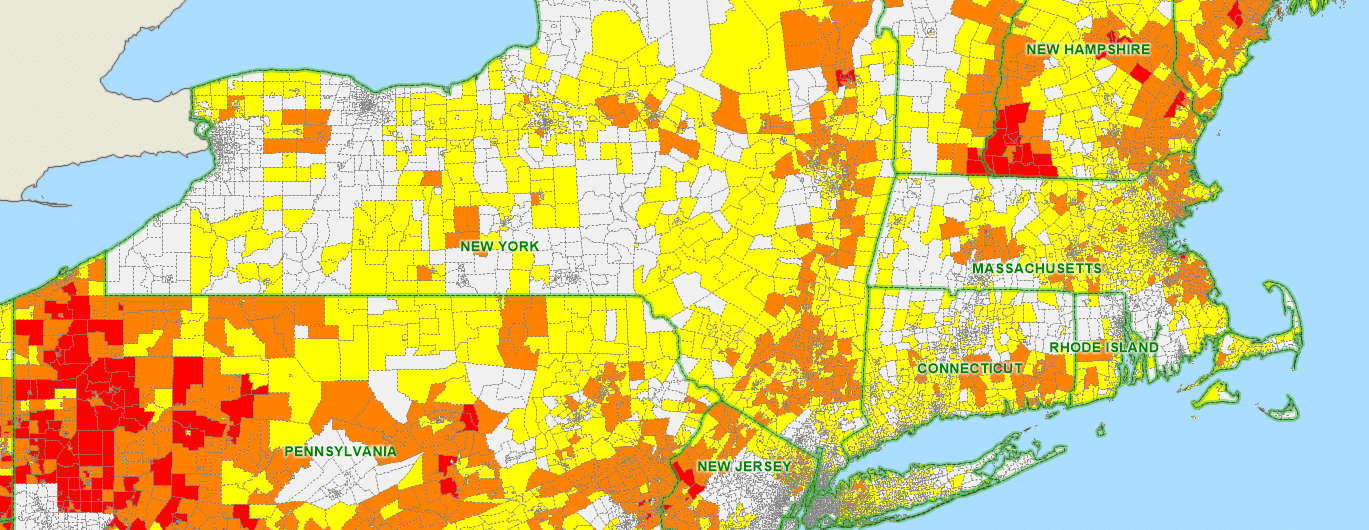
GeoDataVision's

Practical and Realistic Climate-Risk Analysis to help you measure, monitor, and manage your institution's exposure to climate-related events!
Identify, measure, monitor, and manage your institution’s exposure to climate-related and natural hazard events!
GeoDataVision’s unique Climate Risk Meter™ Analysis makes analyzing your exposure to climate-related events realistic and practical.
Using historical data developed and compiled by federal agencies in collaboration various universities Climate Risk Meter™ will:
- Qualify (“no risk” to “very high risk”) your institution’s level to 18 climate-related events and natural hazards.
- Quantify your expected annual loss exposure.
Risk to Balance Sheet Items
- Measure the risk to any balance sheet item
- Apply loss factors to determine potential loss exposure
Risk to Physical Facilities & Assets
- Measure the risk to your institutions physical facilities & assets
- Determine what risks each facility or asset is most exposed to
Risk to Community
- Develop a climate-related community profile based on the greatest climate-risk exposures in your market
- Determine the most vulnerable and most resilient communities to climate-related events
What’s Included in GeoDataVision’s Climate Risk Meter™ Analysis?
- Reports analyzing the risk exposure for more than a dozen climate-related events down to the census tract level looking at the total risk exposure and expected annual loss
- Color coded worksheets for every record analyzed to easily draw your eye to the records with the greatest exposure to each risk
- Tables and graphs depicting the risk level to the bank’s balance sheet items, physical facilities and assets, and communities
- A detailed community profile showing the what and where the greatest climate-related threats exist within your markets
- Includes details on the communities that are most vulnerable and most resilient to climate-related events
- Dynamic online maps unique to your institution showing the risk exposure at the census tract level and including the bank’s portfolio, market areas, and physical facility locations.
- A professionally written executive summary of the findings of the analysis
Climate-Risk for Financial Institutions in the News:
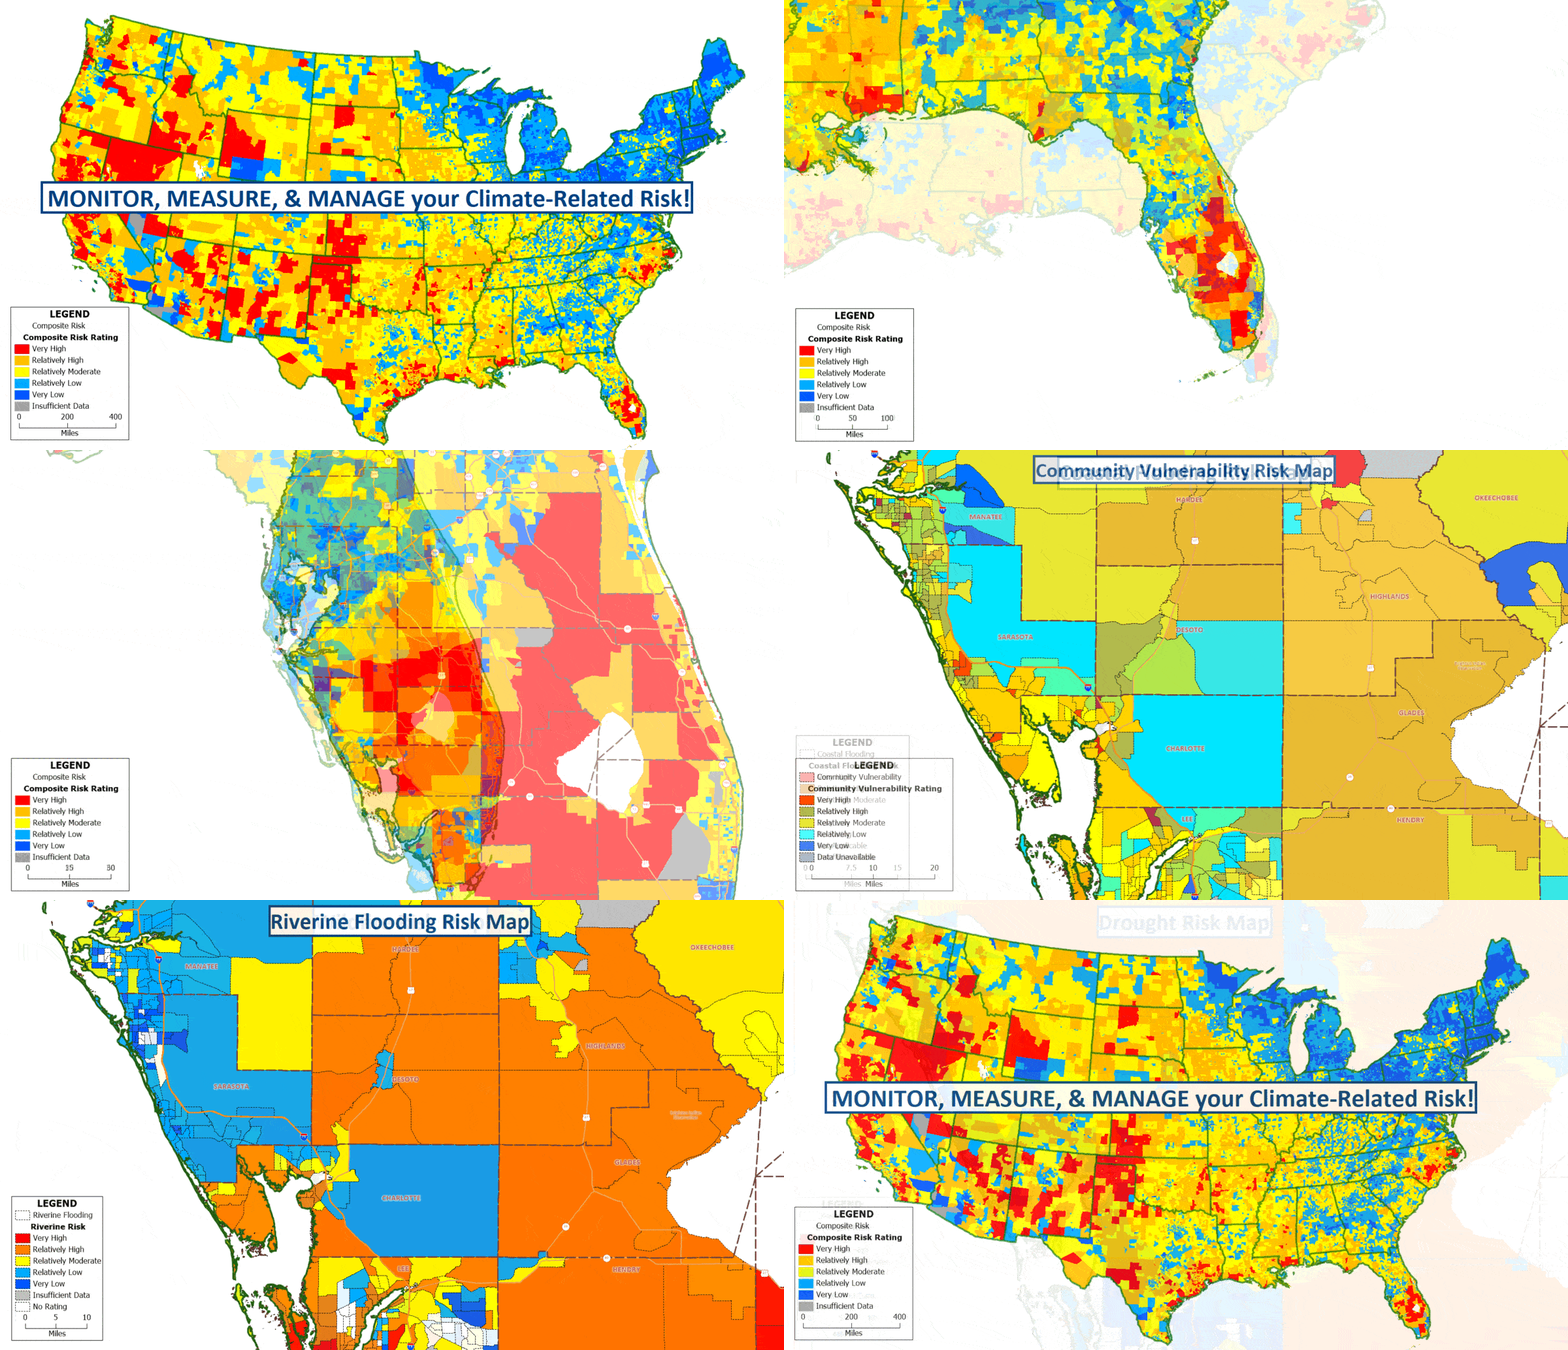
Sample Climate-Related Risk Maps:
- Community Social Vulnerability Map- Base Climate-Risk Map- Social Vulnerability Rating - United State
- Estimate Annual Loss Map- Base Climate-Risk Map- EAL Rating - United States
- Riverine Flooding Map- Base Climate-Risk Map- Riverine Flooding
- Hurricane Map- Base Climate-Risk Map- Hurricane - United States
- Wildfire Map- Base Climate-Risk Map- Wildfire - United States
Contact us for to view a sample of GeoDataVision’s Climate Risk Meter™ Analysis!
Find out more about GeoDataVision's Climate Risk Meter Analysis and contact us today!
© copyright 2026. All Rights Reserved
