The FFIEC released the official 2024 HMDA Aggregate & Disclosure file in June. GeoDataVision uses that data to create special market rank and market share reports for markets everywhere in the USA. This data is invaluable for CRA and Fair Lending analysis and is the same data used by examiners when conducting compliance exams.
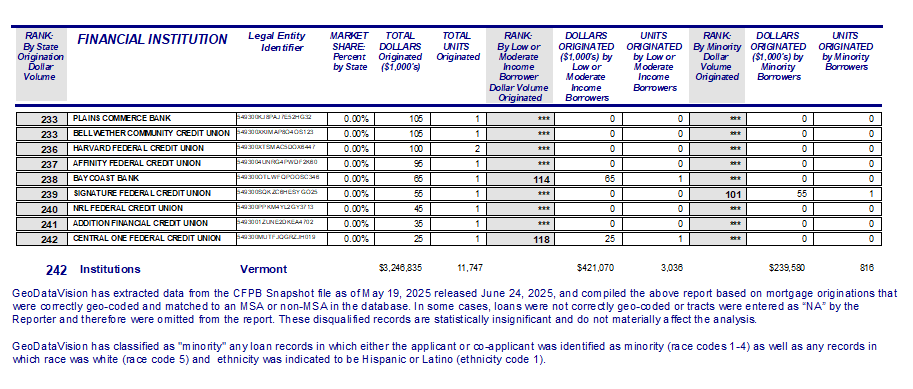
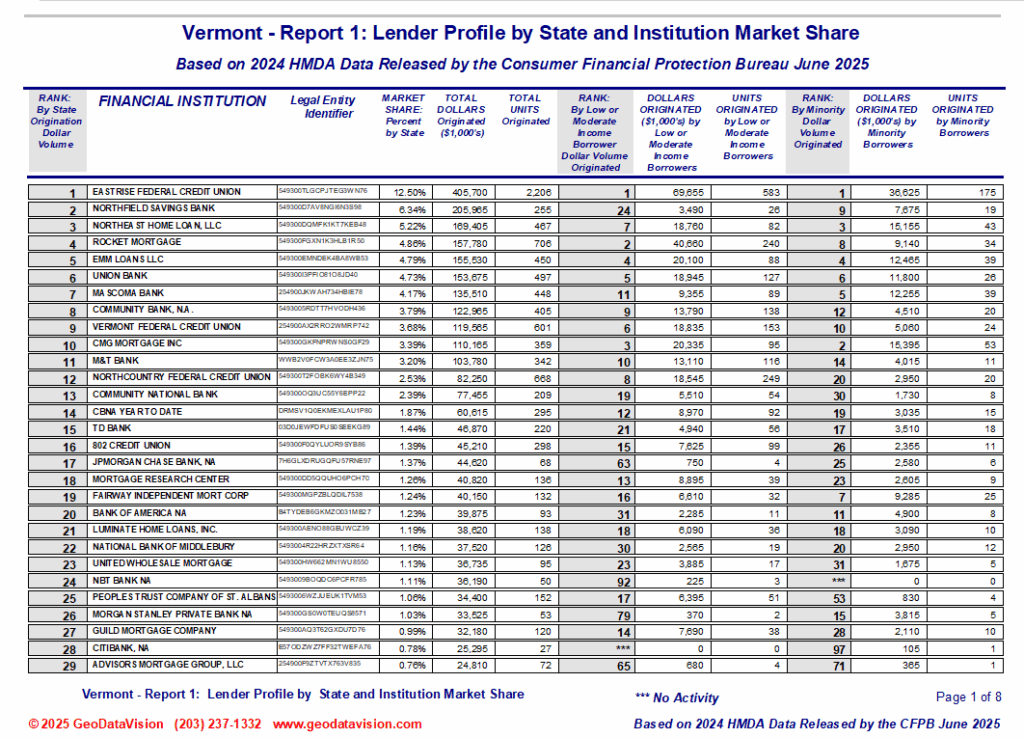
GeoDataVision makes available free copies of the 2024 HMDA Market Rank and Market Share Reports for each state in the US. Those reports not only display the Market Rank and Market Share for all HMDA mortgage lending they also include data on market rank lending to low- and moderate-income borrowers and to minority borrowers.
The reports are part of a suite of reports that include data at the county and census tract levels too.
Free copies of the Statewide Market Rank and Share Reports are available for up to 3 states for anyone requesting the reports.
Special offer
Don't Just Track Compliance—Master Your Market Position
Here's What Your Competitors Already Know About 2024
While you're waiting for your next CRA or Fair Lending exam, your competitors are using 2024 HMDA data to identify untapped opportunities, strengthen their CRA performance, and position themselves as market leaders.
The question is: Are you using the same data examiners will use to evaluate YOU?
Why This Matters NOW
The FFIEC's official 2024 HMDA Aggregate & Disclosure data isn't just compliance paperwork—it's your competitive intelligence goldmine. GeoDataVision has transformed this complex dataset into actionable market intelligence that shows you:
✓ Exactly where you rank against every lender in your market
✓ Your true market share across all lending categories
✓ Critical gaps in LMI and minority borrower outreach
✓ Opportunities your competitors are capturing (and you're missing)
This is the identical data examiners use during compliance reviews. Why wait until the exam to discover where you're falling short?
Get Started Risk-Free
Download your FREE state-level Market Rank & Market Share Report and see instantly:
- Where you stand in total HMDA mortgage lending
- Your performance with low- and moderate-income borrowers
- Your market position in minority lending
- How you compare to every competitor in your state
No credit card. No obligation. Just insight.
Ready to Go Deeper? Unlock the Complete Picture
The Full Market Intelligence Suite: Just $500 per State
Your free state report is just the beginning. Get granular, actionable data with all 5 reports:
- State-Level Overview - Your competitive landscape at a glance
- County Market Analysis - Pinpoint high-opportunity counties
- Census Tract Deep-Dive - Census Tract-level intelligence for CRA assessment areas and potential redlining analysis
- LMI Borrower Performance - Identify service gaps before examiners do
- Minority Lending Insights - Strengthen fair lending compliance risk management
Only $500 for the complete suite. That's less than one hour of consultant fees—for data that protects your compliance rating and reveals growth opportunities.
Who Needs This?
- CRA Officers preparing for exams or strategic planning
- Fair Lending Teams conducting self-assessments
- Market Research Analysts identifying expansion opportunities
- Executive Leadership making data-driven strategic decisions
- Compliance Teams staying ahead of regulatory scrutiny
The Cost of NOT Having This Data
Consider what you risk:
- ❌ Blindsided by exam findings you could have anticipated
- ❌ Missed market opportunities your competitors are seizing
- ❌ Weak CRA performance ratings that limit growth
- ❌ Fair lending vulnerabilities you didn't know existed
- ❌ Strategic decisions made without complete market intelligence
For $500, eliminate these risks entirely.
Two Simple Steps
Step 1: Download your FREE state report today
Step 2: Upgrade to the complete 5-report suite for $500 and gain the competitive edge
Every day you wait is another day your competitors are using this data—and you're not.
Order Your Complete Market Intelligence Suite
Just $500 per state | All 5 Reports | Same Data Examiners Use | Instant Insight


