- Market total originations: 33,624
- Market Originations in MM (Majority-Minority) tracts: 7,872
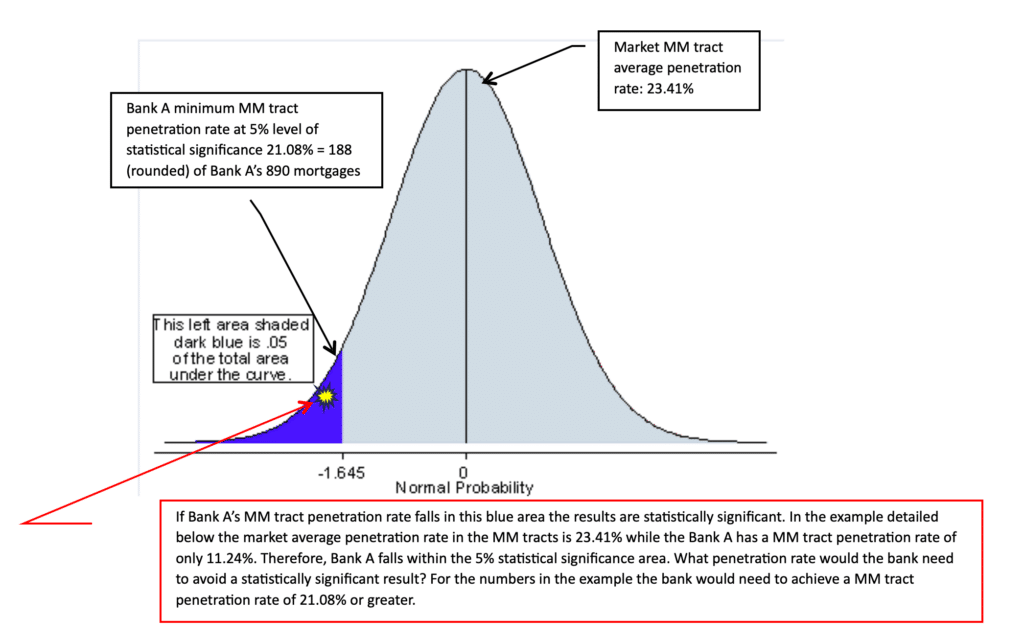
- Market MM tract penetration rate: 23.41%
- Bank A originations in Mkt: 890
- Bank A originations in MM tracts: 100
- Bank A MM Tract penetration rate: 11.24%
Is the Bank's performance statistically significant using a statistical significance level of 5%? Answer: Yes
How many mortgages would the bank need to originate to be above the statistical significance level assuming the same data as above? Answer: the bank would need to extend 188 mortgages in MM tracts at a minimum. This would be a penetration rate of 21.08% (market rate is 23.41%) and would not be statistically significant.
These results will be affected by any change in the market data, and Bank A's volume (sample size - applications or mortgages originated).
What a 5% level statistical significance means is this: The regulators take the position that Bank A's lending in MM tracts is representative of the MM tract lending rate of other lenders in the market (could be all lenders or only peer lenders). That is, if the lenders take applications or make originations in MM tracts at an average rate of 23.41% (from actual market data), then it is assumed that each loan by Bank A has exactly the probability of 23.41% of being in a MM tract, and 76.59% of being in a non-MM tract. If Bank A's actual MM tract penetration rate (the percent of all of its loans in the market) is 23.41% or higher, there's no problem. If Bank A's rate is lower than 23.41%, but only slightly lower, then the regulators would take the position that the discrepancy "is not statistically significant." However, if the lending rate were substantially below 23.41%--which could happen, but would be unlikely--then the regulators must ask "How likely is it that such a discrepancy is due to chance?" The exact answer can be calculated. If the discrepancy has a GREATER than 5% chance of happening, then the regulators will say the discrepancy "is not statistically significant." If the discrepancy is so large that its chance of happening is LESS THAN OR EQUAL TO 5%, the regulators will conclude that Bank A's MM tract Lending rate is not 23.41% (as assumed) but unacceptably lower; the discrepancy will be declared "statistically significant." The so-called Null Hypothesis, that Bank A's MM tract Lending rate is 23.41% or higher, is REJECTED at the 0.05 level of significance.
Put another more technical way, in the numerical example above, a normalized Z-statistic is calculated for the bank’s MM tract lending penetration rate, with the assumption that a rate of 23.41% would yield the value 0. A calculated statistic less than or equal to -1.6450 would place Bank A’s MM tract lending rate in the lower 5% tail of the Normal curve. In the example, this happens when Bank A’s MM tract penetration rate is at or below 21.11%, which makes the discrepancy (23.41% - 21.11%) sufficiently large to be statistically significant to the 0.05 level of significance.

Is your bank vulnerable to charges of redlining?
It is widely known that bank regulators generally don't refer a bank to the DOJ for "redlining" unless a bank's Majority-Minority tract penetration rate is so low that it is statistically significant. So, if your volume of lending in your market's MM tracts is below the market average are your results so low that they may be considered as statistically significant?
As important as that question is, we've encountered a good number of bankers who don't know how they compare to the market and if their results fall into the range of what may be considered to be statistically significant.
GeoDataVision has developed HMDA market reports correlated with statistical significance computations regarding any lender's volume of lending in their Assessment Area or what the bank believes may be its REMA (Reasonably Expected Market Area).
These special reports analyze lending in any market's MM tracts and lending to minority borrowers and compute the outcomes against the 5% level of statistical significance (the level applied by regulators). Of even greater interest to banks that do fall into the 5% statistically significant level of results is that GDV also computes the volume of lending your institution should have done to be above the statistically significant level given the market it operates in and your institution's volume of lending in that market.
If you are interested in these valuable reports please contact GeoDataVision at: jean@geodatavision.com to learn more.

