Previously, I have written about regulatory enforcement of anti-redlining regulations. I pointed out the problems and potentially misleading statistical conclusions caused by the application of what is called a “REMA” or Reasonably Expected Market Area that can be unreasonably expansive and result in a market where a lender cannot compete on a level playing field (manufactured-redlining). I also cited problems caused by failing to recognize that not all mortgages are alike. Counting a mortgage that finances 500 affordable housing units the same as a mortgage that finances a single-family home in low- or moderate-income census tracts creates a distorted picture about bank lending in low- and moderate-income tracts as well as in majority-minority tracts (https://geodatavision.com/content/is-fair-lending-enforcement-fair-today/).
In this follow-up article I address what I consider to be the misuse by regulators of statistical analysis for the purpose of accusing a lender of redlining and referring the matter to the Department of Justice.
The standard approach by examiners when considering whether to refer a lender to the Department of Justice for redlining is to apply a concept called “statistical significance” which is based on the idea that when a certain percentage of the market’s (or peers) reported lending activity is in the Majority-Minority tracts (or some variation thereof) it is assumed that each loan application or origination processed by a lender has the same probability of being in a Majority-Minority tract. The question then is, “how far below the market average MM tract penetration rate can a lender’s MM tract penetration rate be before it is so extreme that it is considered to be not caused by chance, what is called “statistically significant”? Typically, a 5% level of significance is the cutoff point.
An implicit (and critical) assumption underlying this statistical model is that the lenders have certain things in common which would indicate their results should be similar, or within a certain range. The standard model used by examiners assumes that “peers” are determined by lenders whose volume of mortgage application activity in the market falls within 50% to 200% of the volume of the applications processed by the bank being examined. Peers are first determined without regard to the nature of their business (banks, credit unions, mortgage companies). But if the analysis shows the bank being examined has statistically significant results, examiners will sometimes filter the market competitors and include only banks. These efforts notwithstanding, sometimes there are factors that make it difficult to identify true peers operating under similar circumstances.
Qualifying the peers is extremely important to the validity of any statistical analysis and that is where the reliability of statistical analysis can be seriously undermined. There are many factors that can undermine the fairness of comparisons to “peers” who have certain advantages vis a vis a bank being examined.
- A peer may have more physical facilities in a given market (branches, LPO’s, etc.)
- The market (“REMA” or Reasonably Expected Market Area) may be asymmetrical with a concentration of MM tracts in one county and few or no MM tracts in other counties included in the REMA.
A good example of the foregoing can be seen in the following example
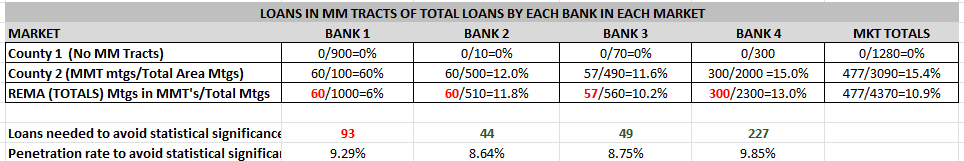
In the foregoing example Bank #1 is headquartered in County 1 which is largely rural or suburban where there are no MM tracts. The other banks are headquartered in County 2, which is highly urban and where there are MM tracts. Bank 1 has a far higher MM tract penetration rate than any of the other 3 banks in County 2. But when the 2 counties are aggregated into a single REMA Bank 1 has a statistically significant shortfall.
How can a bank that outperforms all the other banks in the only county where redlining could have possibly occurred be rated as having “statistically significant” underperformance? The answer is that aggregating the market as if it were a single monolithic community and ignoring factors peculiar to the individual institutions is an oversimplification that distorts the reality of a much more complex situation. That oversimplification, in this example, leads to a seriously misleading statistical conclusion.
Some readers may say that the example itself is too simple and doesn’t reflect the real world. But I can say that I’ve worked with an institution in a similar situation that is being accused of redlining. And I’ve seen redlining complaints filed by the DOJ that have aggregated diverse communities into extremely large REMAs that fail to recognize the diversity of the markets within the REMA.
I have cited only 2 parameters that can undermine the validity of statistical analysis. There are many other factors that may make statistical analysis not only inaccurate, but seriously misleading. It’s incumbent on bankers to know and understand all the factors that should be taken into account when conducting statistical analysis for redlining or other fair lending issues. Here are some possible factors that should be considered:
- Are there “peer” competitors engaged in extensive subprime lending in MM neighborhoods?
- Is all the reported market lending actually helping the MM tracts or is it contributing to “gentrification” that may be hurting the minority community?
- All mortgages are not alike. Does your institution extend multifamily affordable housing mortgages for which you are getting credit for only 1 mortgage but for which you financed hundreds of living units?
- What is the geographic dispersion of minority tracts within the REMA? Are they all concentrated in a confined part of the market or widespread throughout the community?
- Are there competitors that enjoy certain advantages vis a vis your bank (more branches, LPO’s, charters that allow them to offer lower rates, etc.)?
- Has a competitor been sanctioned for redlining and engaged in aggressive lending in minority tracts as a result to cure its deficiency?
To be sure, the Comptroller’s Handbook for Regulatory Compliance does instruct examiners to use “any other data useful for conducting a redlining and marketing analysis” but it would not be prudent to leave that task to examiners in today’s adversarial regulatory climate. The lesson to be learned is that bankers must anticipate how their mortgage volume in the minority tracts in their markets looks from a statistical significance point-of-view and to determine other useful information that may paint a completer and more accurate picture of their performance. In fact, that is the kind of risk management component that is essential to an effective fair lending risk management monitoring program.
