Samples
HMDA Market Data 2023
CRA Market Data 2022
Tract Income Class Map 2024
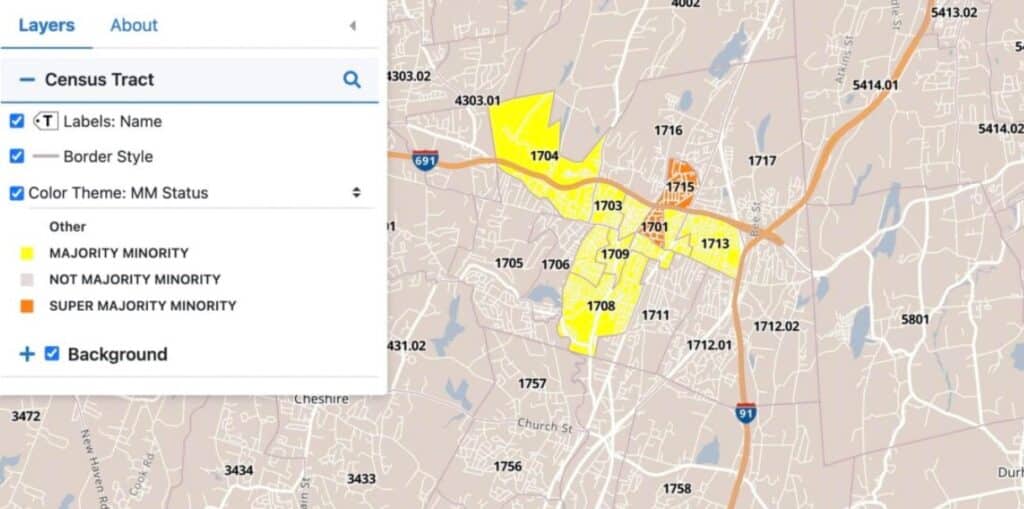
Tract Minority Status Map 2024
MSA Map 2024

Samples
National Community Development Report - By State
National CRA Small Business Market Report - By County
National HMDA Mortgage Market Report - By County
New CRA Demographic Benchmark Report- By State & County
New CRA HMDA Benchmark Report- By State & County
New CRA Small Business Benchmark Report- By State & County
National Census Tract Demographic Report- By County
What data is available in the GeoDataVision CRA and Fair Lending Compliance Resource Center?
- Residential Mortgage Market Rank & Market Share Reports for every state and county plus Puerto Rico and the District of Columbia
- Small Business Loan Market Rank & Market Share Reports for every state and county plus Puerto Rico and the District of Columbia
- Community Development Loan Market Reports for every state plus Puerto Rico and the District of Columbia
- Key Demographic Reports for every state and county plus Puerto Rico and the District of Columbia
What dynamic online maps are available through the Online Mapping Resource Center?
- Interactive online maps that identify the census tract income class of every census tract in the USA
- Interactive online maps that identify the census tract majority-minority status of every census tract in the USA
- Interactive online maps that identify Majority Black census tracts everywhere in the USA
- Interactive online maps that identify Majority Hispanic census tracts everywhere in the USA
- Interactive online maps that depict the latest reported HMDA mortgage origination activity in every tract anywhere in the USA
- Interactive online maps that depict the latest reported small business loan origination activity in every tract anywhere in the USA
All online maps allow you to enter and address and locate it in any census tract in the country.
Are there any unique reports or data available in the Resource Center?
Yes, GeoDataVision has developed a unique series of reports that use the new 2023 CRA benchmarks to estimate what you need to do to potentially attain at least a satisfactory rating under the new CRA performance rating system.
- New CRA small business lending benchmark reports based on the latest CRA reported small business loan originations in every county in the USA including the calculated "penetration rates" needed to potentially receive a satisfactory CRA performance rating for HMDA closed end mortgages
- New HMDA mortgage benchmark reports based on the latest HMDA reported mortgage originations in every county in the USA including the calculated "penetration rates" needed to potentially receive a satisfactory CRA performance rating for small business loan originations
- New CRA demographic benchmark reports (based on the latest FFIEC published demographics) showing the latest demographic data along with the computed minimum performance standards to potentially attain a satisfactory rating
All in all, there are nearly 200 reports that cover all 3,235 counties in the USA, the island areas and Puerto Rico in the GeoDataVision Library. All maps cover the entire USA.
The voluminous data and the online interactive maps that cover everywhere in the USA have a value that exceeds $10,000.00. But GeoDataVision offers this online resource center for only a $900 annual subscription! In fact, because this is a new service GeoDataVision is offering the entire package of maps and reports for only $600 for annual subscriptions received and paid for before May 1, 2025.

