
Key Performance Benchmark Reports (KPBs)
CRA Performance Evaluation Reports
Performance Benchmark Data: CRA does not specify quantitative performance
standards. Instead, examiners rely on performance context data to assess performance.
GeoDataVision has captured, organized and presented this data in a series of reports that
establish the most important quantitative standards against which your bank will be
compared.
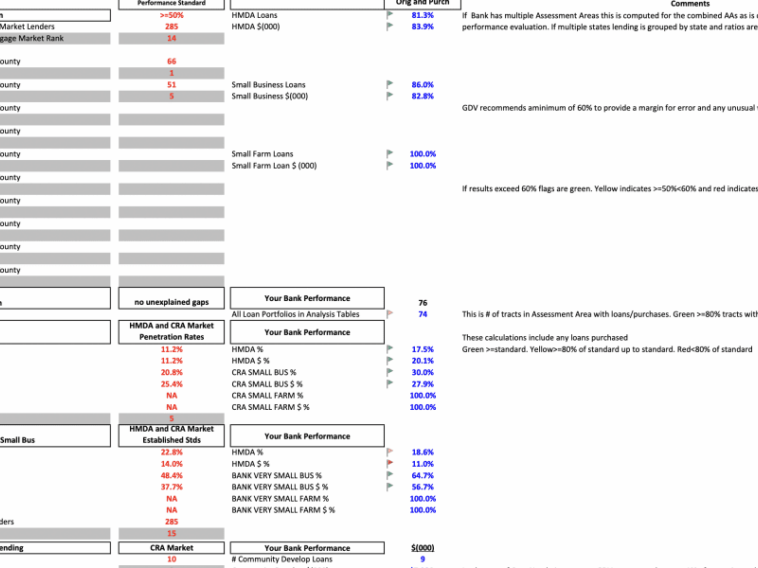
CRA does not specify quantitative performance standards. Instead, examiners rely on “performance context” data to assess performance. GeoDataVision has captured, organized and presented this data in a series of reports that establish the most important quantitative standards against which your bank will be compared. These standards include:
o Benchmark Report 1a - Comprehensive Mortgage Lender Profile Report: This Report summarizes all reported HMDA mortgage activity in your uniquely defined community. The Report shows the volume and value of all mortgage originations and the market rank and market share of all reporting lenders. The Report also shows and ranks every lender’s LMI and minority lending activity. This Report is very valuable for CRA Lending Tests 1 and 4.
o Benchmark Report 1b - Lender Profile Penetration Rates Report: This Report contains the LMI borrower and LMI Tract "penetration rates" of all lenders who reported mortgage originations in your assessment area under HMDA. The "penetration rates" measure the relative percentage of your loans inside the assessment area extended to Low- or Moderate-Income borrowers or within Low- and Moderate-Income census tracts. This Report makes it easy for you to compare your market penetration rate to any other reporting lender within your defined community. This Report is important for CRA Lending Tests 3 and 4.
o Benchmark Report 2 - Mortgage Lender LMI Tract Ranking Report: This report ranks and compares all the lenders and their activity in your assessment area’s LMI tracts. This Report is invaluable for CRA Lending Test 3.
o Benchmark Report 3 - Detailed Mortgage Borrower Profile Report: This Report breaks down all mortgage loan activity by Borrower income class for each and every census tract within your assessment area. This Report is pertinent to CRA Lending Tests 2, 3 and 4.
o Benchmark Report 4 - Detailed LMI Tract Mortgage Borrower Profile: This Report correlates LMI borrowers with LMI tract activity and is important for CRA Lending Tests 3 and 4.
o Benchmark Report 5 - Assessment Area Concentration Ratios: This report summarizes, lists and compares every lender in your state with respect to the relative commitment of lending resources in their assessment area. This Report allows comparison of your bank to every lender in your state under CRA Lending Test 1.
o Benchmark Report 6 - Comprehensive CRA Small Business Lending Report: This Report captures all reported small business loans for each and every census tract in your uniquely defined assessment Area. The Report is another element in CRA Lending Tests 1, 2 and 3.
o Benchmark Report 7 - CRA Lending in Assessment Area LMI Tracts: This Report focuses on the critical lending in the LMI neighborhoods in your defined community. The data used in this Report applies to CRA Lending Test 3.\
o Benchmark Report 8a - CRA Lender Profile Report: This Report details, ranks and compares the small business lending activity of reporting lenders in any county which is included in your assessment area. This Report is fundamental to CRA Lending Test 1.
o Benchmark Report 8b & 8c - CRA Small Business Lender Ranking: presents the market rank and market share for small business lending in the low- and moderate-income census tracts for each county. This Report provides an important perspective on CRA Lending Test 3 that measures a lender's performance lending within the Assessment Area LMI tracts. The Report allows the user to see the lending activity other CRA-reporters and compare to the user bank's small business lending LMI tract penetration rates. Similar to KPB Report 8a, the data is organized and compiled at the county level because the county level geography is the lowest geographic level for which lender identity is disclosed in the national CRA Disclosure files.
o Benchmark Report 9 - Community Development Lending: This Report displays and ranks all lenders based in your state and their reported community development lending activity. Essential for CRA Lending Test 5.
o Benchmark Report 10 - CRA Very Small Business Rankings: This Report compares and ranks all CRA reporting lenders based on their lending to very small businesses. Critical to CRA Lending Test 4.
o Benchmark Report 11 - CRA Very Small Business Loan Index: This Report creates an index of the relative amount of lending to very small businesses ($1 million or less annual revenue) that allows comparison of all reporting lenders in your state. Even small banks can compare to and outperform large banks because the index levels the playing field. Critical to CRA Lending Test 4.
Need help?
Prefer speaking with a human to filling out a form? Call our corporate office and we will connect you with a team member who can help.
(203) 907-7497
© copyright 2024. All Rights Reserved
